
Despite of the pro and cons, there’s no doubt that a lot of people still using Microsoft product. Recently I finally got the chance to feel the experience using the latest Microsoft Office Suite, the 2007 version. Working in research department means a lot of spreadsheet calculation and all done in Microsoft office excel. In working with large dataset, I (we) often found numerous limitations with previous version of Microsoft office excel, the 2003 version.
And surprisingly, somehow…the features on 2007 version solve a lot of limitations. My two favorite features are…
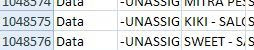 One, the maximum rows in excels. As we all know, the previous version of Microsoft excel (2003 and older), cannot handle approximately more than 65000 rows of data (2^16). Believe me, in research that’s far from enough. These limitations force us to work tediously.
Now, Microsoft office excel 2007 can handle up to 1048576 rows of data (2^20), that’s fifteen (15) times larger than the previous.
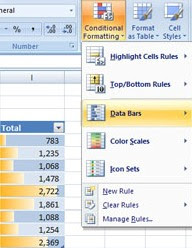 Two, the conditional formatting, more likely a dashboard for those who are familiar with “Business Intelligence”.
Now, you can easily make a chart or indicator or whatever the name is… Directly at the excel row or column cell. It measures the value in several columns or rows instantly.
There are a lot more features I can share with… But i don’t want known as one of Microsoft marketing people..haha.. 🙂
Terima kasih sudah sharin informasinya
Keep up the good work